R scripts
I would like to use this page to share a few scripts from the programming language R to produce a diversity of graphics for scientifc publications.
1. My first example is a Principal Component Analysis Biplot with confidence ellipses based on six cranio-dental (GLS, CIL, MTL,
BaM, BB, and PB) and one external (FA) measurements measured in 48 female specimens of bats Molossus spp. Through this analysis, we showed that M. barnesi from French Guiana was in fact a junior synonym for M. coibensis. To produce this PCA Biplot with confidence ellipses, I relied on a R script with different R packages: ggbiplot, grDevices and plyr. Using the function pdf(), I could directly produce a pdf of the figure with the correct dimensions.
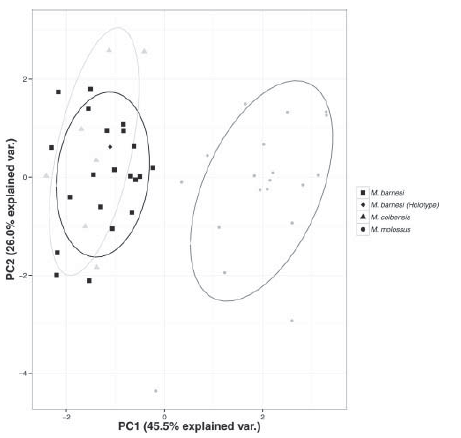
You can find this graphic in the following publication (Figure 2):
Catzeflis F., Gager Y., Ruedi M., Thoisy B. de. 2016.
The French Guianan endemic Molossus barnesi (Chiroptera: Molossidae) is a junior synonym for M. coibensis.
Mammalian Biology: doi:10.1016/j.mambio.2016.05.004
2. My second example is a bivariate plot combined with frequency distributions of forearm length (mm) vs. body mass (g) for 526 M. molossus, 64 M. coibensis and 27 M. bondae (the first two genetically assigned to species). In combination with a Linear Discriminant Function, we could use this graph to see which combination of parameters correspond to the three different species. To produce this plot, I used a R script relying on the packages ggplot2, gridExtra and MASS.
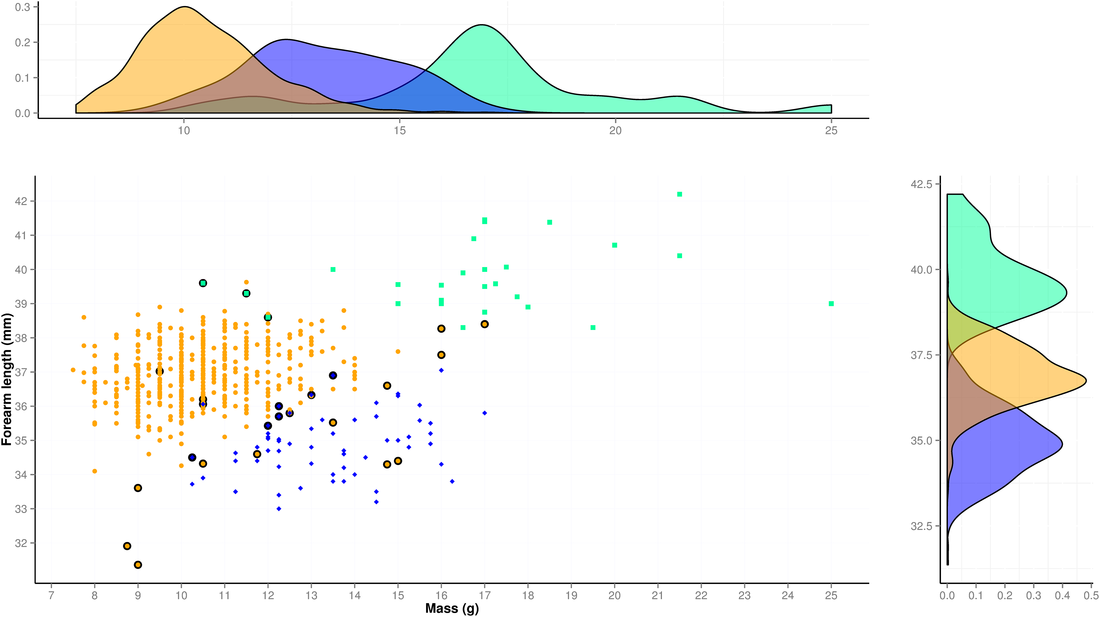
You can find this graphic in the following publication (Figure 5):
Gager Y., Tarland E., Lieckfeldt, D., Ménage M., Botero-Castro F., Kraus R.H.S., Rossiter S.J., Ludwig A. & Dechmann D.K.N. 2015.
The value of molecular vs. morphometric and acoustic information for species identification using sympatric molossid bats.
PLOS ONE. DOI: 10.1371/journal.pone.0150780
3. The third example that I wanted to share with you are boxplots with temporal variation of total group size (adults and juveniles) in the bat Molossus molossus. Group size increased during July and August, coincident with juvenile fledging. To produce this plot, I used a R script to automatically calculate group size for a given social group and a given month (a large piece of the code consisting of cleaning the database is not included in the version presented here).
You can find this graphic in the following publication (Figure 2):
Gager Y., Gimenez O., O’Mara M. T. & Dechmann D. 2016.
Group size, survival and surprisingly short lifespan in socially foraging bats.
BMC Ecology 16:2. DOI 10.1186/s12898-016-0056-1
Gager Y., Gimenez O., O’Mara M. T. & Dechmann D. 2016.
Group size, survival and surprisingly short lifespan in socially foraging bats.
BMC Ecology 16:2. DOI 10.1186/s12898-016-0056-1
